二手 Tektronix TDS520B 在 玛丽湖, 佛罗里达, 美国
二手
Doubleclick to zoom in
请联系卖家咨询
更多照片和设备细节。
规格参数
描述
同类产品
Tektronix TLA5201
TEKTRONIX 5201
Tektronix 2520
Tektronix TLA5202B
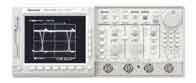
The Tektronix TDS520B oscilloscope is a graph-displaying device - it draws a graph of an electrical signal. In most applications, the graph shows how signals change over time: the vertical (Y) axis represents voltage and the horizontal (X) axis represents time. The intensity or brightness of the display is sometimes called the Z axis.
The Tektronix TDS520B oscilloscope's simple graph can tell you many things about a signal, such as: the time and voltage values of a signal, the frequency of an oscillating signal, the �moving parts� of a circuit represented by the signal, the frequency with which a particular portion of the signal is occurring relative to, other portions, whether or not a malfunctioning component is distorting the signal, how much of a signal is direct current (DC) or alternating current (AC) and how much of the signal is noise and whether the noise is changing with time.
制造商: Tektronix
模型: TDS520B